



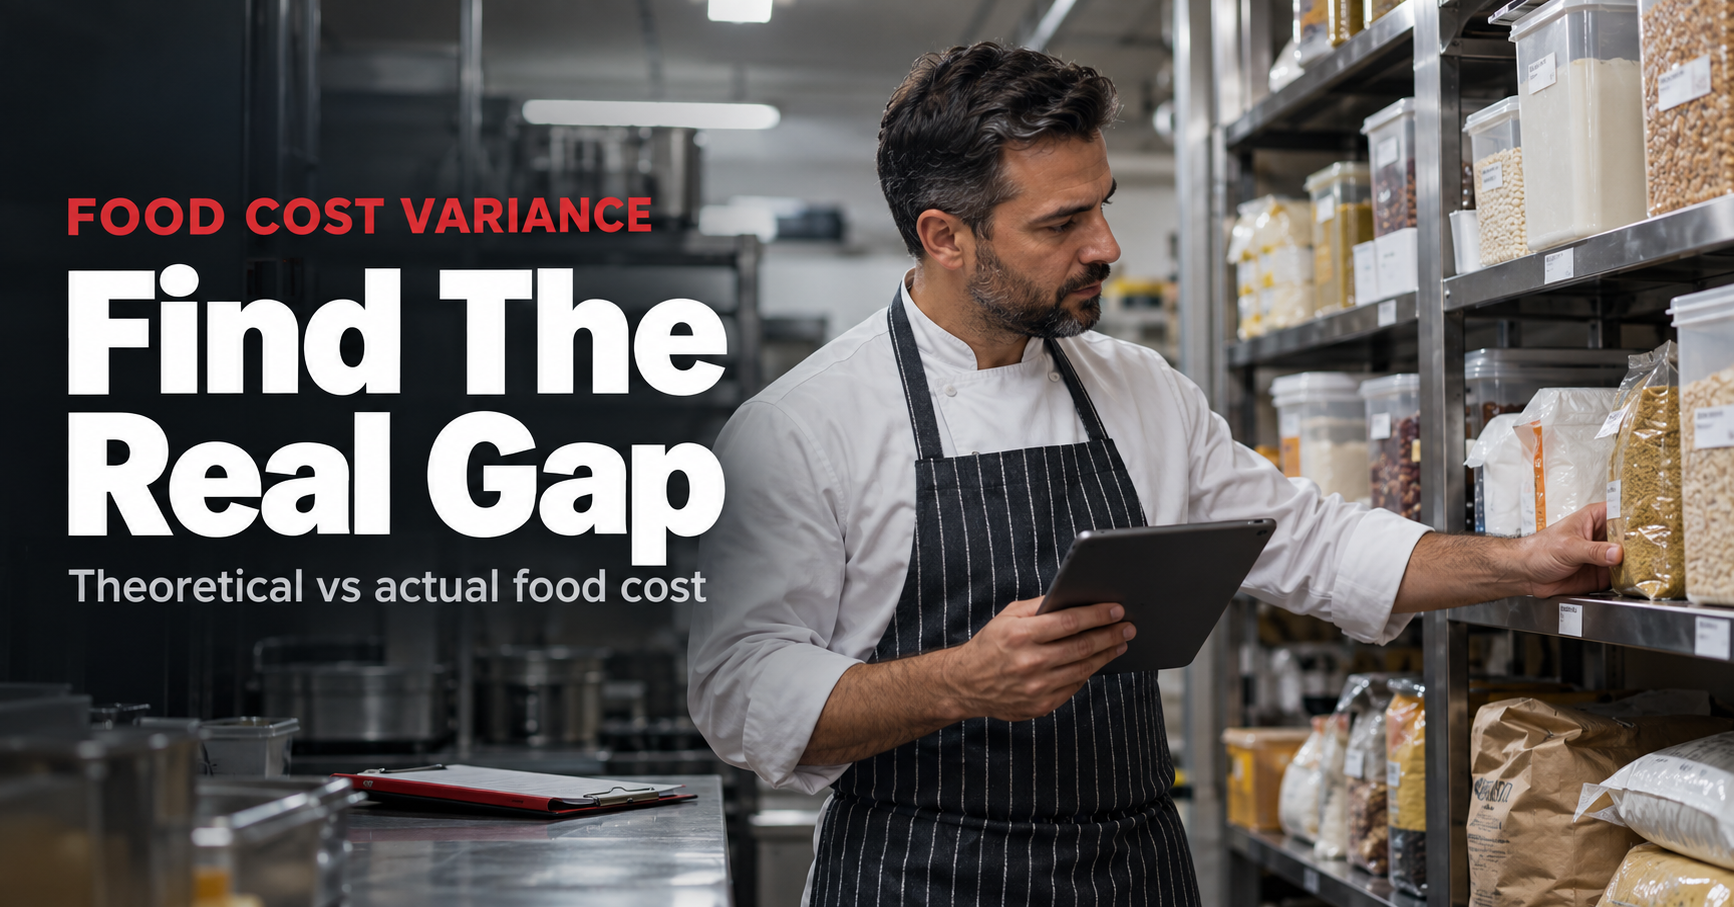
Your food cost report says one thing. Your stock count says another. For an Operations Director running more than one site, that gap is not a rounding error. It is where margin quietly disappears.
This article sets out what theoretical and actual food cost actually measure, the operational reasons they drift apart, and a five-step way to close the gap that goes beyond re-running the same report every month. Run a quick check with a free stocktake app to see where your own numbers land before reading on.
What Is Theoretical Food Cost?
Theoretical food cost is the amount your kitchen should have spent on ingredients, based on what you sold and what each recipe costs to make. It comes from four inputs: recipe data, including ingredient quantities; the sales recorded on your menu; current ingredient prices; and the number of portions sold.
Multiply the recipe cost per portion by the number of portions sold for every dish, add the totals, and divide by revenue. The result is a benchmark, not a forecast. It tells you what the kitchen should have spent if every portion matched the recipe card exactly.
What Is Actual Food Cost?
Actual food cost is what the kitchen genuinely used or lost over a given period. It is calculated from stock movement: opening stock, plus purchases, minus closing stock.
Because it comes from physical counts rather than recipe assumptions, actual food cost reflects what really happened in the kitchen, not what should have happened on paper. A free food cost calculator is a fast way to see where your own theoretical number currently sits, before comparing it against your last few stock counts.
What Does the Gap Between Them Actually Mean?
A mismatch between theoretical and actual food cost is the variance. Some variance is normal. No kitchen hits its recipe cards perfectly every single day.
The concern is a variance that is large, or that keeps recurring. If actual food cost sits persistently above theoretical, the kitchen is using more stock than its sales and recipes account for. That does not automatically mean stock is being lost. It means the gap needs investigating before it can be explained.
Why Does Food Cost Variance Happen?
According to WRAP’s Overview of Waste in the UK Hospitality and Food Service Sector, unrecorded and avoidable food waste costs UK restaurants an estimated £682 million a year. A figure that size is a reminder that even a small unexplained variance is worth investigating rather than writing off. In practice, variance tends to trace back to one or more of the following.
Is Waste and Spoilage Driving the Gap?
Unrecorded waste, spoiled stock and unused leftovers all create variance. Without consistent logging, the effect of the waste shows up in the numbers long before the cause does. Pairing waste records with stock data is usually what surfaces it.
Are Portion Sizes Slipping?
Recipes set out how much of each ingredient a dish should use. In practice, portions drift. One over-poured dish barely registers. Repeated across hundreds of covers a week, it becomes a measurable gap. Standardised recipes, correct portioning tools and periodic spot checks help hold the line.
Are Stocktaking Errors Skewing the Actual Number?
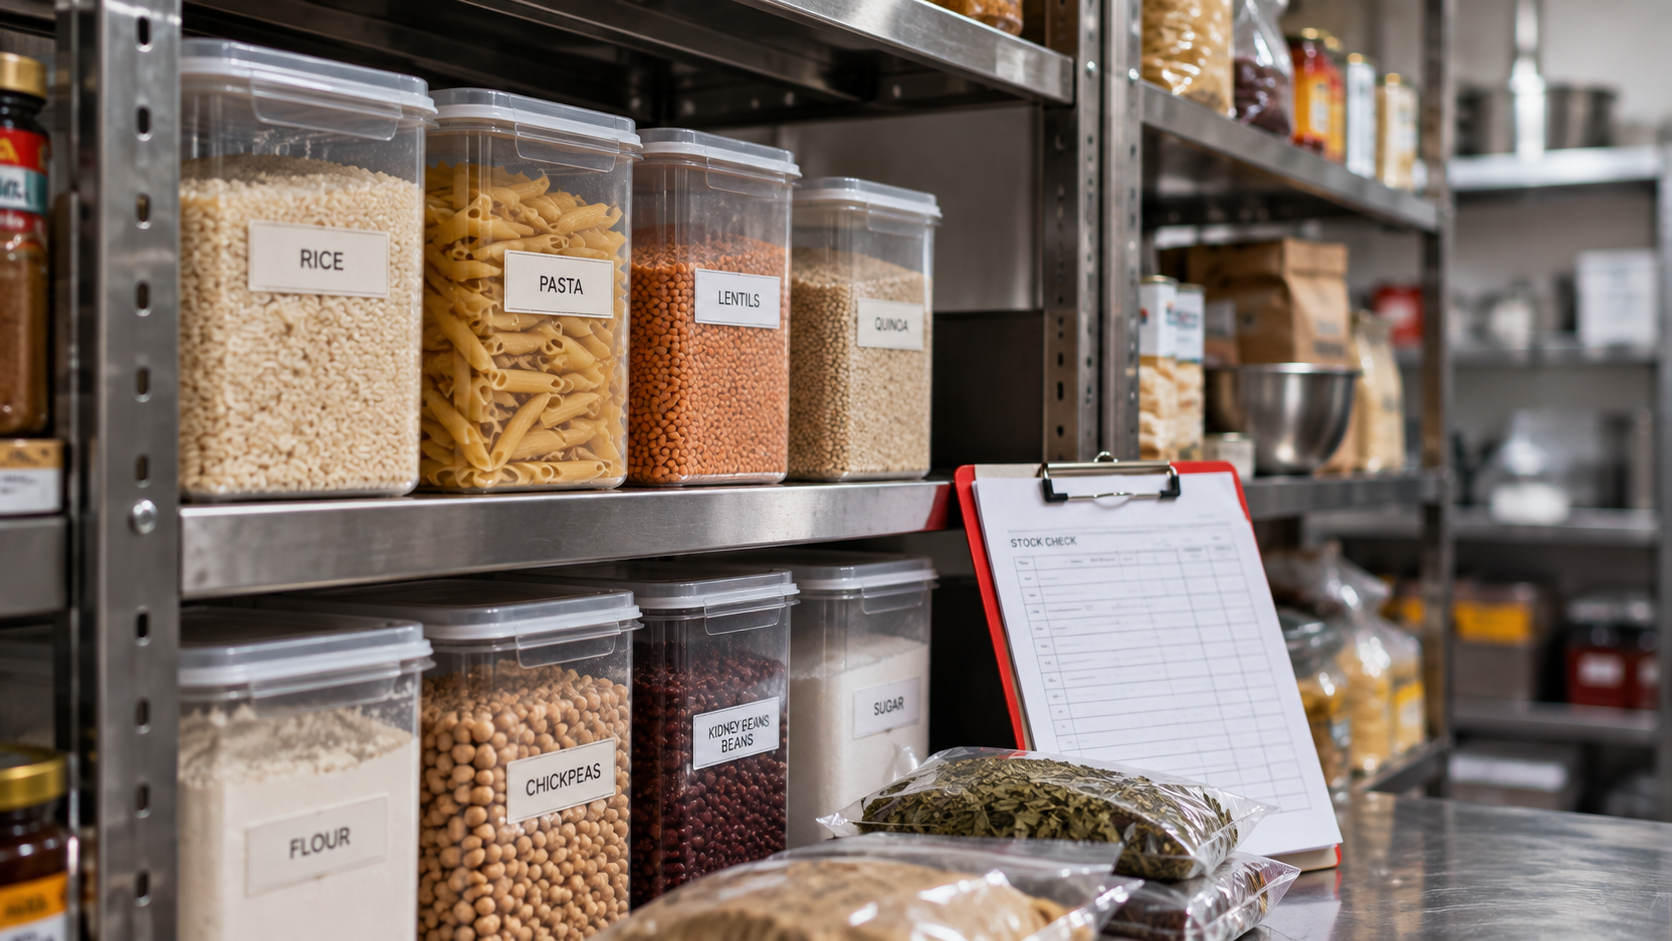
Actual food cost is only as good as the stock count behind it. Wrong quantities, wrong units, items logged in the wrong location, duplicate entries and simple omissions all distort the number before any analysis starts. A standardised stocktaking process is the foundation everything else in this article depends on.
Is Stock Moving Without Being Recorded?
Stock moves between kitchens, storage areas and, in multi-site groups, between venues. If a transfer is not logged, one location appears to be short while another looks like it is holding surplus. This is one of the most common reasons a single-site view of variance is misleading for group operators, and one of the first things worth checking before assuming a genuine loss.
Have Supplier Prices Outpaced Your Recipe Costs?
Theoretical food cost assumes a given price and a given recipe. When supplier prices move and recipe costs are not updated to match, the theoretical number stops representing what the dish actually costs to make, which distorts every variance calculation that follows. Reviewing supplier pricing and recipe costs on a set schedule keeps the benchmark honest.
How Do You Reduce the Variance Gap?
The goal is not to force actual and theoretical numbers to match exactly. It is to understand why they differ. This is the fixed five-step routine we call the STO 5-Step Variance Clarity Framework.
- Find the variance. Identify the products, recipes and sites with the largest gaps between theoretical and actual numbers.
- Diagnose the cause. Investigate waste, portioning, purchasing, stock movements and counting accuracy for those specific items.
- Verify the underlying data. Confirm recipes, ingredient prices and stock levels are current before drawing conclusions.
- Act on the operational issue. Fix the root cause on the floor, not the number in the spreadsheet.
- Track the trend. Recheck the same products and sites over the following weeks to see whether the gap closes.
Run this way, variance stops being a month-end shock and becomes a routine part of weekly management.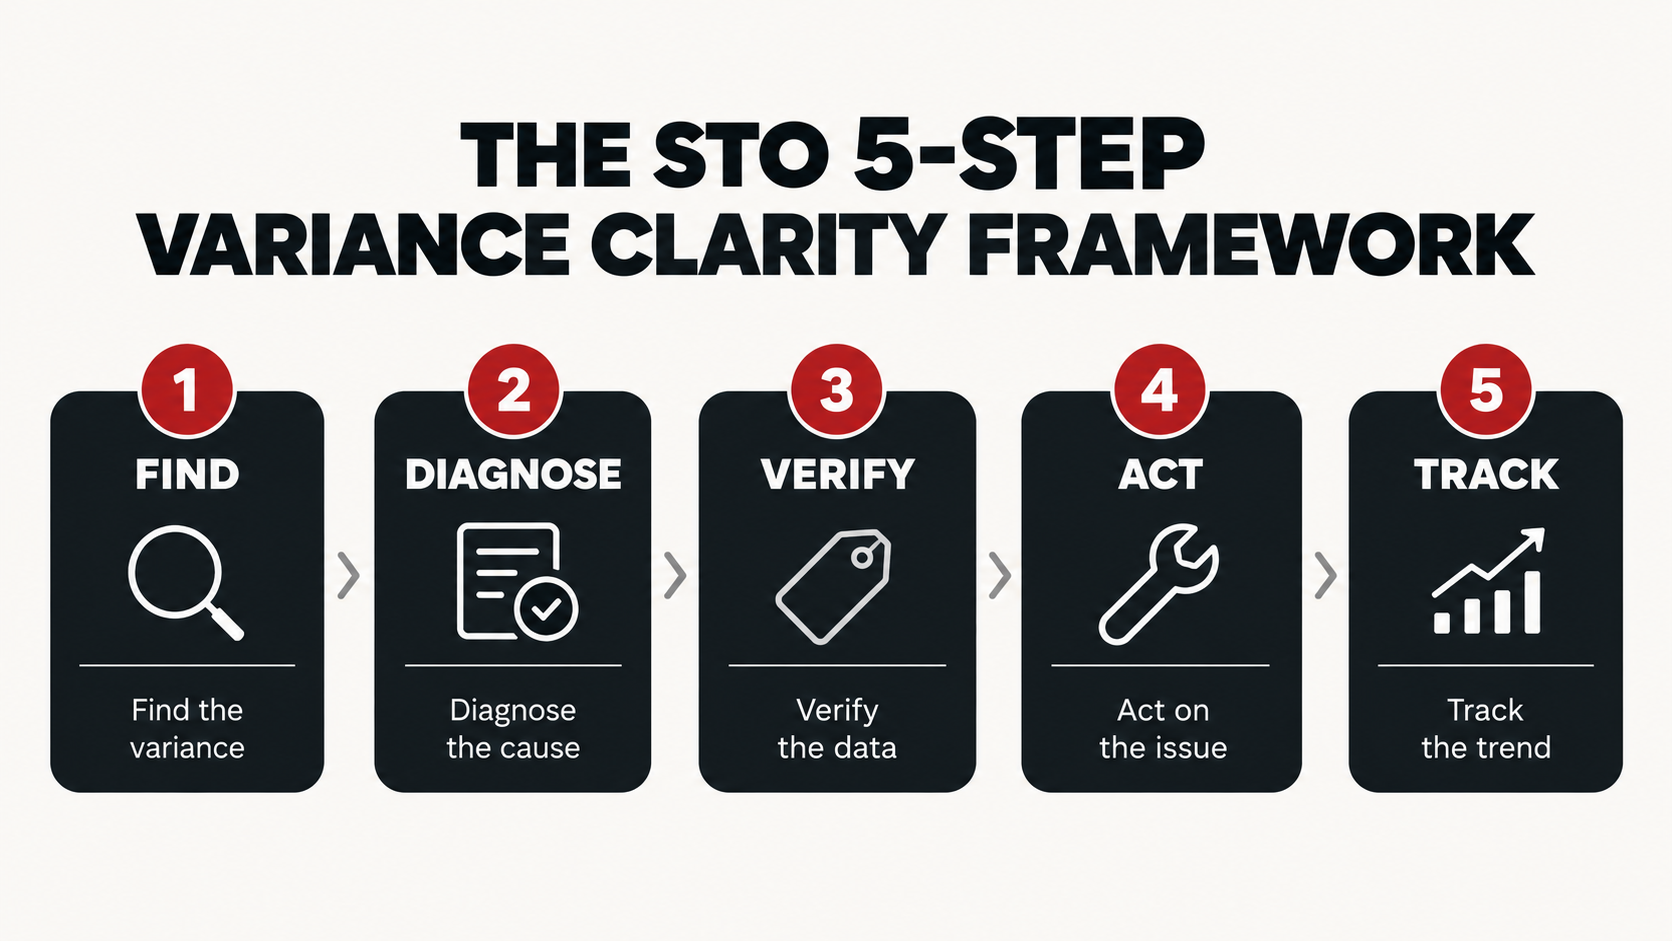
How Does Technology Help Close the Gap?
In a single-site kitchen, comparing theoretical and actual food cost by hand is manageable. Across a multi-site group, it usually is not. The data sits in separate spreadsheets, stock cards, purchase orders and standalone accounting systems, and by the time it is pulled together, the window for a useful correction has often closed.
StockTake Online brings stocktaking, recipe costing, purchasing, food cost and reporting into one system, so an Operations Director can see variance by site rather than as a single blended group number. StockTake Online’s reporting and analytics tools make it possible to isolate which location, which supplier or which menu item is driving a gap, rather than averaging it away across a whole estate.
One multi-site Operations Director summed up the shift this way (illustrative, not a StockTake Online client quote): “We stopped asking what the variance was and started asking why it kept turning up at the same three sites.”
The aim is not another report to file away. It is to make the question “what caused the variance?” answerable in minutes rather than at month-end.
Theoretical vs Actual Food Cost at a Glance
|
|
Theoretical Food Cost |
Actual Food Cost |
|
Built from |
Recipes, prices and units sold |
Opening stock, purchases and closing stock |
|
Answers |
What the kitchen should have spent |
What the kitchen did spend |
|
Assumes |
Recipes and prices are current and accurate |
The stock count itself is accurate |
|
Best used for |
Setting the benchmark and pricing menus |
Diagnosing waste, theft and process gaps |
|
Common failure point |
Stale recipe costs or unadjusted supplier pricing |
Inconsistent counting or unrecorded transfers |
What Is the Takeaway for Multi-Site Operators?
The difference between theoretical and actual food cost tells you more than whether you hit a target percentage. It shows where stock usage is diverging from expectation, which gives operations teams an early signal that something is off before it reaches the P&L.
The more useful question is not “what is our variance?” but “what caused it?” With accurate stocktaking, current recipes and properly recorded stock movements, teams can close the visibility gap between food cost and GP%.
Want to see where your own variance sits? Book a demo of StockTake Online, or start with the free stocktake app above to check your own numbers first.
Key takeaways
- Theoretical food cost comes from recipes, prices and sales; actual food cost comes from stock movement.
- A small, stable variance is normal. A large or growing one is worth investigating.
- The five common causes are waste, portion drift, stocktaking errors, unrecorded transfers and stale supplier pricing.
- Adjusting the theoretical number does not fix variance caused by real operational waste.
- The STO 5-Step Variance Clarity Framework turns variance into a weekly habit rather than a month-end surprise.
- Multi-site groups need variance visibility by location. A blended group figure can hide a serious problem at one site.
Frequently asked questions
What is theoretical food cost? Theoretical food cost is the calculated cost of ingredients based on recipes, current ingredient prices, and the number of portions sold.
What is actual food cost? Actual food cost is the real cost of the food used, calculated from opening stock, purchases and closing stock.
Why is there a difference between theoretical and actual food cost? The gap, known as variance, is usually caused by waste, portion drift, stocktaking errors, unrecorded stock transfers or supplier prices that have moved without recipe costs being updated.
Is food cost variance always a problem? No. Some variance is normal and expected. A consistently high or unexplained variance is what is worth investigating for an underlying operational issue.
How can restaurants reduce food cost variance? By keeping recipes accurate, running a standardised stocktaking process, recording waste and stock transfers properly, checking supplier prices regularly, and investigating any variance that persists.