



Restaurant reporting software converts stock, sales and supplier data into food cost, Gross Profit, variance and prime cost reports. Operators use it to catch margin loss early, not at month end. Food costs, supplier prices and labour rates keep moving in 2026, so a monthly spreadsheet review is usually too slow to act on.
What Is Restaurant Reporting Software?
Restaurant reporting software takes the operational data your kitchen and bar already generate and turns it into readable reports. Instead of storing numbers, it shows trends, inefficiencies and where margin is leaking.
Depending on the platform, the reports typically cover:
- Food cost
- Stock variance
- Gross Profit (GP%)
- Prime cost
- Supplier pricing and buying trends
- Multi-site comparisons
- Reports are compiled manually, one spreadsheet at a time
- Reports are pulled from several unrelated spreadsheets that do not talk to each other
- Managers spend hours each week on inventory reconciliation instead of running the business
- A food cost increase is only discovered after month end
- Different sites use different methods to produce operational reports
- Reports take days to compile, so decisions are made on outdated information
- Food cost, stock variance, GP%, prime cost, supplier and multi-site reports are the six that consistently protect restaurant margin.
- Cost pressure is not easing: ONS data shows restaurant and hotel prices rising faster than food inflation overall in early 2026.
- Reporting only helps if it triggers action; the Margin Radar Framework groups reports by the action each one should trigger.
- Manual spreadsheet reporting tends to break down once a business runs multiple sites or needs daily, not monthly, visibility.
- StockTake Online keeps stocktaking and reporting in one platform, so the numbers are reconciled rather than rebuilt from exports.
Good restaurant reporting software does not just answer what happened. It helps explain why, and what to do next.
Why Does Restaurant Reporting Matter in 2026?
Cost pressure has not eased for UK hospitality. According to the Office for National Statistics (January 2026), restaurant and hotel prices rose 4.1% year on year, faster than the 3.6% rise in food and non-alcoholic beverage prices overall. When input costs move that fast, operators who only check the numbers monthly are usually reacting a month late.
Reporting on its own does not protect margin. What matters is the action it triggers: adjusting a supplier order, correcting a recipe cost, or tightening a stocktake process before the loss compounds.
Which Reports Should a UK Restaurant Track?
Not every report carries equal weight. These six consistently affect the bottom line directly:
1. Food cost report. Tracks food spend against sales and flags sudden cost increases early, so buying decisions can adjust before margin slips.
2. Stock variance report. Compares actual stock to expected stock. A high variance usually points to waste, over-portioning, recording errors or theft.
3. Gross Profit (GP%) report. Shows income left after food and beverage cost of sales, and whether current menu pricing still holds up.
4. Prime cost report. Combines food and labour cost into one number, useful for isolating whether a cost rise is supplier-driven, labour-driven, or both.
5. Supplier report. Shows spend by supplier, buying pattern shifts and whether pricing is still competitive, which supports better procurement negotiations.
6. Multi-site comparison report. For groups, compares food cost and GP% across venues, so head office can see which sites are performing and which need support.
How Do These Reports Protect Margin? The Margin Radar Framework
StockTake Online groups these six reports into four checks, an approach worth naming the Margin Radar Framework, because each check sweeps a different part of the operation for early signs of margin loss.
Cost Radar
Food cost and supplier reports together, watching for supplier price creep and buying pattern drift before it shows up in the GP% line.
Loss Radar
The stock variance report, isolating waste, over-portioning, recording mistakes and shrinkage as separate, investigable causes rather than one vague number.
Profit Radar
GP% and prime cost together, connecting the cost side of the business to the labour side, so a margin dip can be traced to its actual driver.
Network Radar
The multi-site comparison report, giving head office one place to see which venues are on track and which need a visit, without waiting for month-end consolidation.
Illustrative example: multi-site operators often describe the shift from month-end surprises to daily margin visibility as the biggest operational change reporting brings. (Illustrative, not an attributed client quote.)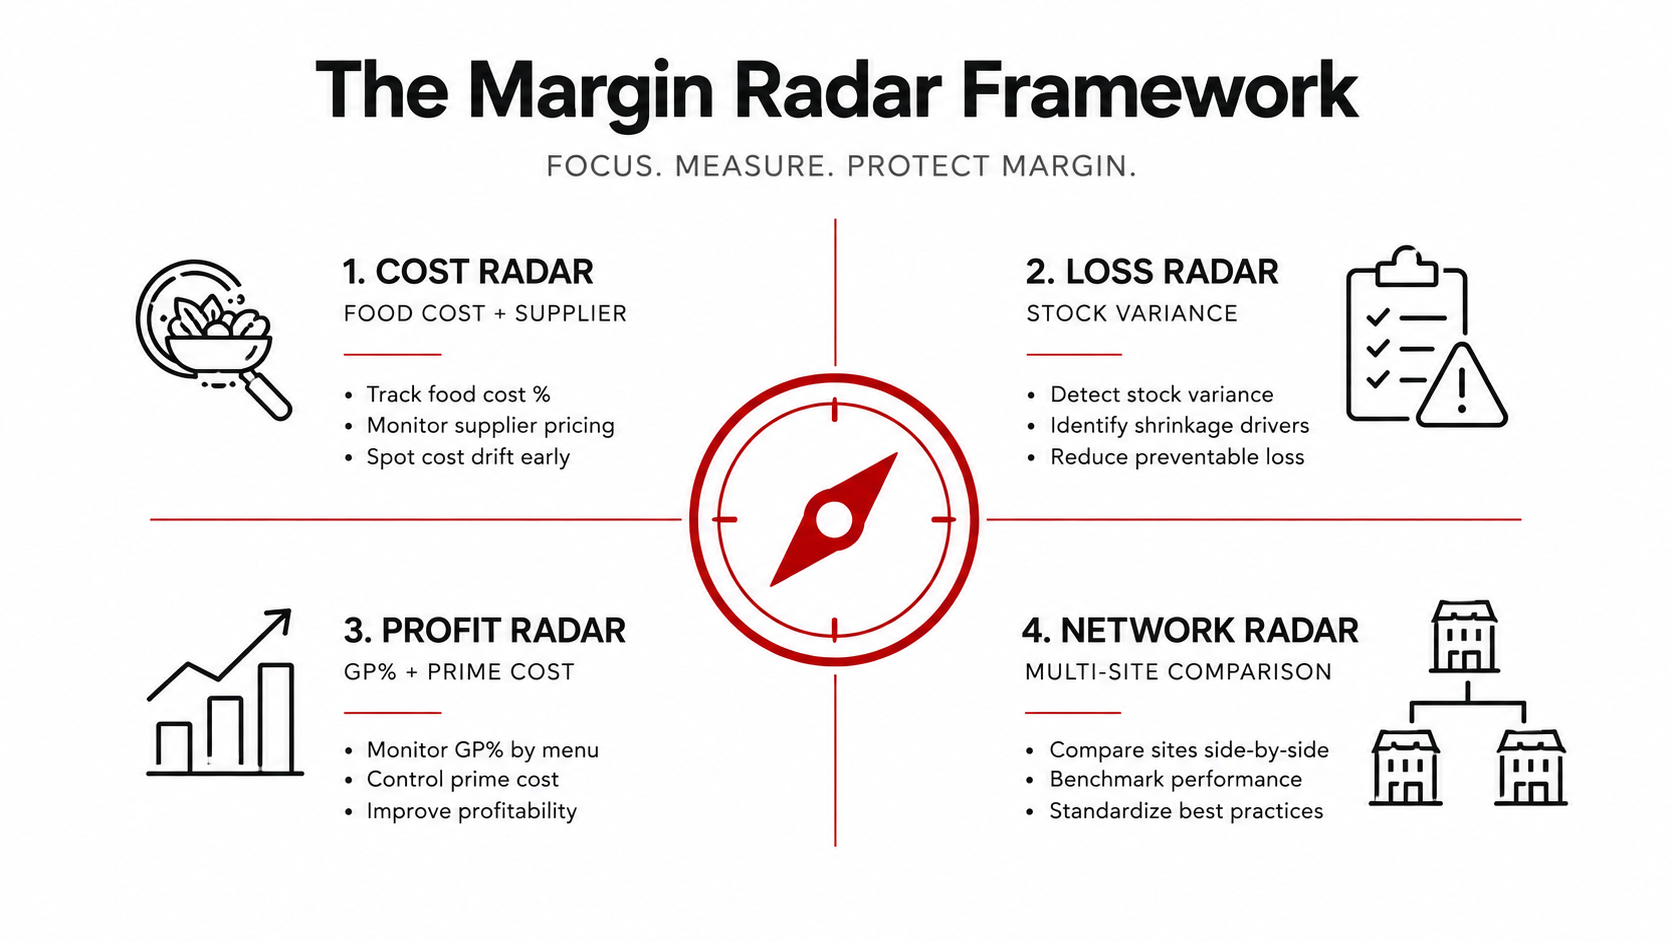
What Are the Signs Your Reporting Strategy Is Holding You Back?
Many restaurants still run reports from spreadsheets. That approach can work at a small scale, but it usually starts breaking down once a business shows several of the following signs:
If two or three of these are familiar, a dedicated reporting platform is likely to save more time than it costs to set up.
Manual Spreadsheets or Dedicated Reporting Software?
|
Aspect |
Manual spreadsheets |
Dedicated reporting software |
|
Update frequency |
Weekly or monthly, depending on capacity |
Daily, as stock and sales data comes in |
|
Consistency across sites |
Varies by site and by manager |
One format, one dashboard, every site |
|
Time to compile |
Often days per reporting cycle |
Minutes, since reports build automatically |
|
When issues surface |
Usually after month end |
As the variance or cost shift happens |
|
Best suited to |
A single small site with light reporting needs |
Multi-site groups and any operator wanting daily margin visibility |
How Does StockTake Online Help Protect Margin?
StockTake Online is a UK cloud restaurant inventory platform built around real-time stock control, recipe and menu costing, procurement and supplier management, and reporting across food cost, stock variance, GP% and prime cost, for single sites and multi-site groups alike. Reporting sits inside the same platform as stocktaking, so the numbers are already reconciled rather than rebuilt from separate exports.
A practical first step for any operator is to see the food cost picture directly: try the free food cost calculator, which needs no sign-up and no commitment.
For a fuller view of what daily reporting looks like across food cost, GP% and multi-site comparisons, see the restaurant analytics software page.
Supplier-side reporting connects directly to procurement: the supplier management software page covers how buying trend and price-tracking reports feed into the Cost Radar check above.
If the reports above already sound like a gap in how your restaurant operates, book a demo to see StockTake Online's reporting suite against your own numbers.
Frequently Asked Questions
What is restaurant reporting software? It is software that gathers a restaurant's operational and inventory data and produces reports on food cost, stock variance, Gross Profit, prime cost and supplier activity, so operators can monitor performance in one place.
Why is restaurant reporting important in 2026? Food, supplier and labour costs continue to move quickly. Reporting gives operators real-time visibility into performance so problems can be caught and corrected before they affect profitability at month end.
Which reports should a restaurant monitor most closely? Food cost, Gross Profit (GP%), prime cost, stock variance, supplier reports and, for groups, multi-site comparison reports are the six with the most direct impact on margin.
Can reporting software replace spreadsheets entirely? For most multi-site groups, yes. A single small site with light reporting needs may still manage on spreadsheets, but the time cost usually grows faster than the business does.
What is the advantage of StockTake Online for restaurant reporting? StockTake Online combines stock control, recipe costing and reporting in one cloud platform, so food cost, variance, GP% and supplier reports are built from the same reconciled data rather than separate spreadsheet exports.