


|
UK pubs and bars control pour cost by shortening the gap between a cost rise and the glass. Each week they capture new delivered prices, recost every serve that uses those lines, review menu prices against a target gross profit band, then check actual usage against EPOS sales so the costing holds behind the bar. |
How UK Pubs and Bars Control Pour Cost in 2026/27
UK pubs and bars control pour cost by shortening the time between a cost rise and the glass. Heading into 2027, that matters more than the formula itself. Supplier prices change on an invoice, often weeks before anyone updates a serve cost or a menu price, and every pint poured in that gap sells at the old margin.
This guide sets out a weekly control routine for licensees, bar managers and owners of one to three sites. If you need the calculation first, read how to calculate beverage cost percentage, then come back here for the control side.
What does controlling pour cost mean in 2026/27?
Pour cost is the cost of a drink divided by its selling price net of VAT, shown as a percentage. Beverage gross profit is the other side of the same number: a 33% pour cost is a 67% GP. Controlling pour cost means keeping every serve inside the target band you set for it, as costs move underneath you.
Costs are moving again. According to HM Revenue & Customs (28 October 2026), all alcohol duty rates, including the reduced draught relief rates, are uprated in line with RPI by 4.55% from 1 February 2027. At the new draught beer rate of £20.34 per litre of alcohol, duty on a pint of 4% ABV draught beer works out at roughly 46p, so the uprating itself adds around 2p a pint (our arithmetic, for illustration).
The duty line is rarely what hurts. HMRC’s own impact note assumes producers will raise wholesale prices to reflect the change, and those increases land on delivery notes on the supplier’s timetable, not yours. The real exposure is the lag. Supplier price lists may move around the duty date, so put a full price review in the diary for the first full week of February 2027.
Why does pour cost drift when nobody is over-pouring?
Most drift has nothing to do with heavy-handed staff. It comes from three quieter sources.
Price lag. A keg, case or bottle goes up, the invoice is paid, and the serve cost on the spreadsheet stays where it was. The menu price follows weeks or months later, if at all.
Spec drift. A cocktail gains a premium mixer, a house wine moves to a larger glass, a garnish changes. Nobody recosts the serve, so the menu price is anchored to a recipe that no longer exists.
Yield loss. Line cleaning, fobbing, ullage, breakages and unrecorded staff drinks or comps mean fewer saleable measures come out of each keg or bottle than the costing assumes.
A monthly stocktake shows the combined result of all three, but only after the money has gone. Control means catching each one while it is still a decision.
What is the Invoice-to-Glass Loop?
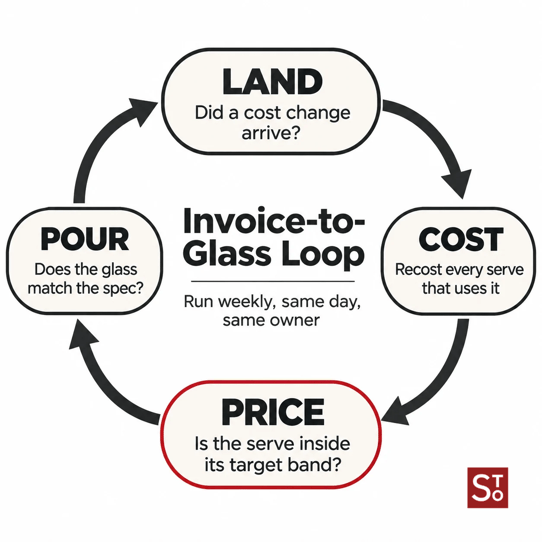
The Invoice-to-Glass Loop is the four-stage routine we recommend for keeping pour cost on target as prices change. Each stage asks one question and needs one piece of evidence. Run it weekly, on the same day, by the same person.
Land: did a cost change arrive this week?
Check every delivery against the last price paid for that line. Any change, up or down, is flagged on the day it lands, with the supplier, the old price and the new price. This is where most pubs lose the thread, because the invoice goes to the accounts pile rather than to the bar manager.
Cost: has every serve using that line been recosted?
One price change can touch a dozen serves: the pint, the half, the double, three cocktails and a pitcher. Update the cost of every serve that uses the line, not just the obvious one, and use realistic yields rather than the theoretical maximum.
Price: does the serve still sit inside its target band?
Compare each recosted serve with the target band you set for its category. Draught, spirits, wine, cocktails and soft drinks usually carry different targets, and the right numbers depend on your venue, your trade mix and your local market. Where a serve has slipped out of band, choose a response from the table below and record the decision with a date.
Pour: is the glass matching the spec?
A correct costing only protects margin if the glass matches it. Each week, count your fastest-moving and highest-value lines, reconcile usage against EPOS sales, and price any gap in pounds. If theoretical and actual pour cost diverge, the problem is in the pour, the till or the cellar, not the price.
How much does a slow price review cost a pub?
Illustrative example: the figures below are invented for clarity. They are not taken from any customer, benchmark or survey.
A pub sells a lager at £5.80 a pint, about £4.83 net of VAT at the standard 20% rate. It pays £135 for an 11-gallon keg (88 pints) and, after line cleaning and fobbing, gets around 95% yield, or about 84 saleable pints. That puts the cost of a sold pint at about £1.62 and pour cost at 33.4%.
The supplier then raises the keg to £143. Cost per sold pint rises by roughly 10p to £1.71, and pour cost moves to 35.4%. On a line selling 400 pints a week, that is about £38 a week of margin gone. If the menu price is reviewed quarterly, around 12 weeks can pass before anyone acts: roughly £460 on one line, before counting the other serves that use the same keg.
To return that pint to a 33.4% pour cost, the selling price would need to move to about £6.15. Whether that is the right call depends on your trade, which is why the decision belongs in the Price stage rather than in a formula.
“The keg went up in March and the pint price moved in June. That gap was the quarter’s GP.”
Illustrative quote, written to reflect a common operator experience. Not a customer testimonial.
Run your own top three lines through the free beverage cost calculator to see where they sit today.
Should you absorb, re-price, re-spec or switch supplier?
When a serve drifts out of band, there are four realistic responses. Most pubs use all four across a menu. The mistake is defaulting to one.
|
Response |
When it fits |
What to watch |
Evidence to check next week |
|
Absorb |
Small or temporary rise on a price-sensitive anchor line |
Small rises compound across several lines |
Line GP% against target |
|
Re-price |
Permanent rise on a line with price headroom |
Local competition and round-number pricing |
Volume sold after the change |
|
Re-spec |
Cocktails, mixers, garnishes, glass sizes, house pours |
Guest perception and menu accuracy |
New serve cost against the old spec |
|
Switch or renegotiate |
Line available from more than one supplier |
Contract terms, quality and delivery reliability |
Landed price across three deliveries |
Whichever you choose, write it down. A decision with a date can be reviewed. A price nobody remembers setting cannot.
What does a weekly pour cost routine look like?
This is the Invoice-to-Glass Loop as a weekly checklist. For a single site it is usually one focused session. Groups run it per site and compare.
- Pick a fixed day and owner, ideally after the week’s main deliveries.
- List every line whose delivered price changed since last week, with old and new prices.
- Recost every serve that uses those lines, including halves, doubles, cocktails and pitchers.
- Sort serves by gap to target and review the five furthest out of band.
- Choose absorb, re-price, re-spec or switch for each, and record the decision and date.
- Count your top movers and high-value lines, reconcile usage against EPOS sales, and price the gap in pounds.
- Assign one fix for the biggest gap and check it again next week.
Where does software fit in pour cost control?
The loop works on paper. It breaks down when the Land and Cost stages depend on someone retyping invoices into a spreadsheet at the end of a long week.
Supplier price tracking records each delivered price against the last one, so a change is visible when the stock arrives. Serve costs can then update from the same data, and EPOS integrations with Toast, Lightspeed, Aloha EPOS, TISSL, Grafterr and HubRise reconcile stock against what was actually sold. Counts run on a phone or tablet, with no extra hardware.
For pubs and bars, bar inventory management software brings the four stages into one view by line, category and site. It does not choose your prices. It shortens the gap between a cost change and the moment you can decide what to do about it.
Where should you start this week?
Start with one number. Take your three best-selling draught lines and your house spirit, run each through the beverage cost calculator, and compare the result with your target. If any are out of band, work through the Invoice-to-Glass Loop for those lines first.
If you are reading this before 1 February 2027, run the loop on your draught and spirit lines now, then again once February delivery prices land. If you want to see the loop running on live supplier prices and EPOS sales across your bar, Book a Demo with the StockTake Online team.
Key takeaways
- Pour cost control in 2026/27 is mainly about speed: the gap between a cost rise and a menu decision.
- Alcohol duty rises 4.55% from 1 February 2027, but the bigger exposure is wholesale increases landing unnoticed on invoices.
- Drift comes from price lag, spec drift and yield loss, not only from over-pouring.
- The Invoice-to-Glass Loop runs four stages weekly: Land, Cost, Price, Pour.
- Every out-of-band serve gets one recorded response: absorb, re-price, re-spec or switch.
Frequently asked questions
What is the difference between pour cost and beverage GP?
Pour cost is a drink’s cost as a percentage of its selling price net of VAT, and beverage GP is the remainder. A serve with a 30% pour cost has a 70% GP. Both should be calculated on net prices, never on the price including VAT.
How often should a pub review drink prices?
Review serve costs weekly and change menu prices when a serve stays outside its target band, rather than waiting for a fixed quarterly review. Weekly checks catch supplier increases while they are still a few pence per serve.
How will the February 2027 alcohol duty rise affect pour cost?
Only slightly on its own. Duty rises 4.55% from 1 February 2027, which on a pint of 4% draught beer is about 2p. The larger effect usually comes from wholesale price increases that follow, so track delivered prices from February rather than the duty rate alone.
Should a pub pass every supplier price rise on to customers?
Not automatically. A small or temporary rise on a price-sensitive line may be worth absorbing, while a permanent rise on a line with price headroom usually justifies a menu change. The point is to decide deliberately and record the decision.
Can software control pour cost without a full weekly stocktake?
Software can flag price changes and recost serves automatically, but actual pour cost still needs counts. Most bars count their top movers and high-value lines weekly and run a full count less often, using EPOS data to target the lines that matter.