


How to Reduce Food Cost in a Restaurant: 9 Levers That Protect Margin
Food cost is the largest controllable cost in most kitchens, and it rarely gets out of hand in one dramatic moment. It leaks. A supplier price rises quietly, a chef over-portions a garnish, a delivery gets signed for without being checked, and three months later the gross profit line has slipped two points and nobody can say exactly why.
This guide sets out nine practical levers for reducing food cost, organised into a simple framework you can apply this week. It is written for owners, operations directors, finance leads and head chefs running restaurants, pubs, bars, hotels and multi-site groups. None of the levers involves cutting portion sizes or buying cheaper ingredients. The goal is to stop paying for food that never earns you revenue.
What does it actually mean to reduce food cost?
Definition: Food cost percentage is the cost of the food used in a period divided by the food sales it generated, multiplied by 100. Reducing food cost means closing the gap between what your menu says a dish should cost to produce and what your kitchen actually spends producing it.
That distinction matters. Your theoretical food cost is what each dish should cost based on recipes, current ingredient prices and portion specs. Your actual food cost is what the stock movement in the period says you really used. Almost every kitchen has a gap between the two, and that gap, not the headline percentage, is where the recoverable money sits. Cutting quality lowers the theoretical number and usually damages sales. Closing the gap lowers the actual number and damages nothing.
Why is food cost rising even when sales look healthy?
Input prices are one pressure, but rarely the whole story. The Office for National Statistics reported that food and non-alcoholic beverage prices rose by 1.7 per cent in the 12 months to June 2026, the lowest annual rate since August 2024. If inflation has cooled and your food cost percentage is still creeping up, the cause is inside the operation, not the market.
The usual culprits are supplier price creep that nobody spots line by line, invoices that do not match what was delivered, recipes that were costed once and never updated, prep waste that never gets recorded, and stock counts done too rarely or too roughly to show where usage is running ahead of sales. Each one on its own looks too small to chase. Together they routinely explain the difference between the margin you planned and the margin you got.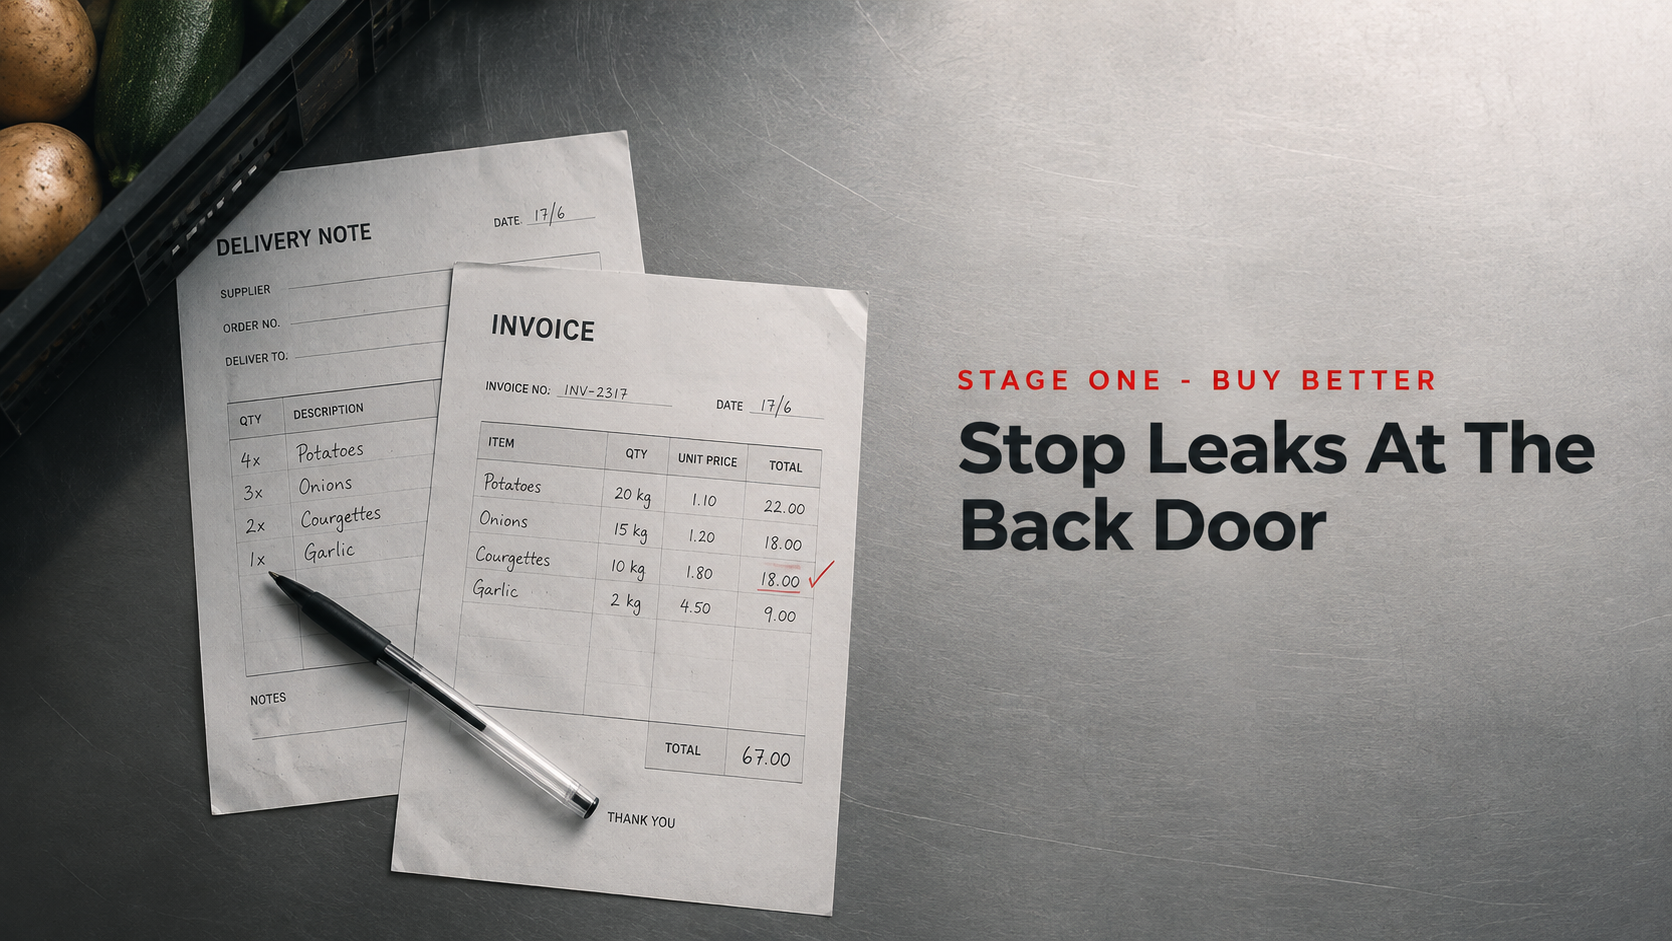
Where should you start? The Margin Leak Map
The nine levers below are grouped into three stages that mirror how food moves through your business: you buy it, you use it, you sell it. Work the stages in order. Buying fixes protect every plate that follows; selling fixes only protect the plates you have already produced efficiently.
|
Stage |
Levers |
What leaks here |
|
Buy better |
1. Track supplier prices 2. Check invoices against deliveries 3. Order to par with purchase orders |
Price creep, overcharging, over-ordering and the waste that follows it |
|
Use better |
4. Cost every recipe and portion 5. Record yields and prep waste 6. Measure theoretical vs actual usage |
Uncosted dishes, silent over-portioning, trim and prep loss, unexplained variance |
|
Sell better |
7. Price the menu to protect GP 8. Count stock on a fixed cadence 9. Report by site and hold the line |
High-cost dishes sold hard, counts too infrequent to catch problems, no accountability loop |
How do you buy better?
Lever 1: track supplier prices line by line. Suppliers rarely announce increases; they simply invoice them. A price file that logs what you paid per item, per supplier, per delivery turns creep into a visible trend you can challenge or shop against, and dedicated supplier and procurement management tools build that file automatically from your invoices. Reviewing the top 20 items by spend each month covers most of the exposure with the least effort.
Lever 2: check invoices against what actually arrived. Weights, quantities, substitutions and unit prices should all be reconciled before an invoice is approved. Kitchens that sign on the dotted line at the back door pay for shortages and substitutions forever. Photographing delivery notes and matching them to invoices, or letting software scan and match them automatically, makes this a minutes-per-day habit rather than a month-end chore.
Lever 3: order to par with purchase orders. Par levels sized to real usage, plus a purchase order for every order, kill the twin problems of over-ordering and untraceable spend. Excess stock is not a safety blanket; it is future waste sitting on a shelf, tying up cash while it ages.
How do you use better?
Lever 4: cost every recipe and enforce the portion spec. A dish that has never been costed cannot be managed. Every menu item needs a recipe card with current ingredient prices, target portion weights and a resulting theoretical cost. When ingredient prices update, recipe costs should update with them, which is exactly the kind of recalculation that is painful in a spreadsheet and instant in software. Our guide to keeping dish margins accurate when supplier prices change weekly covers the workflow in detail.
Lever 5: record yields and prep waste. A kilogram of raw product is not a kilogram of sellable product. Trim, shrinkage and prep errors reduce yield, and if your recipe costs assume 100 per cent yield they are flattering you. Recording waste as it happens, even roughly, tells you whether the problem is buying spec, knife skills or portioning.
Lever 6: measure theoretical vs actual usage. This is the master metric. Compare what your sales mix says you should have used against what your stock counts say you did use. The difference is variance, and every point of it has a cause: waste, over-portioning, unrecorded transfers, theft or counting error. You cannot fix what you have not measured, and you cannot measure it without accurate counts and costed recipes, which is why levers 4, 5 and 8 come as a set. For a step-by-step diagnosis of each cause, see our theoretical vs actual food cost guide.
Worked example (illustrative only). A pub kitchen takes 40,000 pounds in monthly food sales. Its costed recipes and sales mix say usage should have been 12,400 pounds, a 31 per cent theoretical food cost. The month-end count shows actual usage of 14,000 pounds, 35 per cent. The four-point gap is 1,600 pounds a month, or roughly 19,200 pounds a year, leaking from one site before a single menu price changes. These figures are illustrative to show the method, not benchmarks.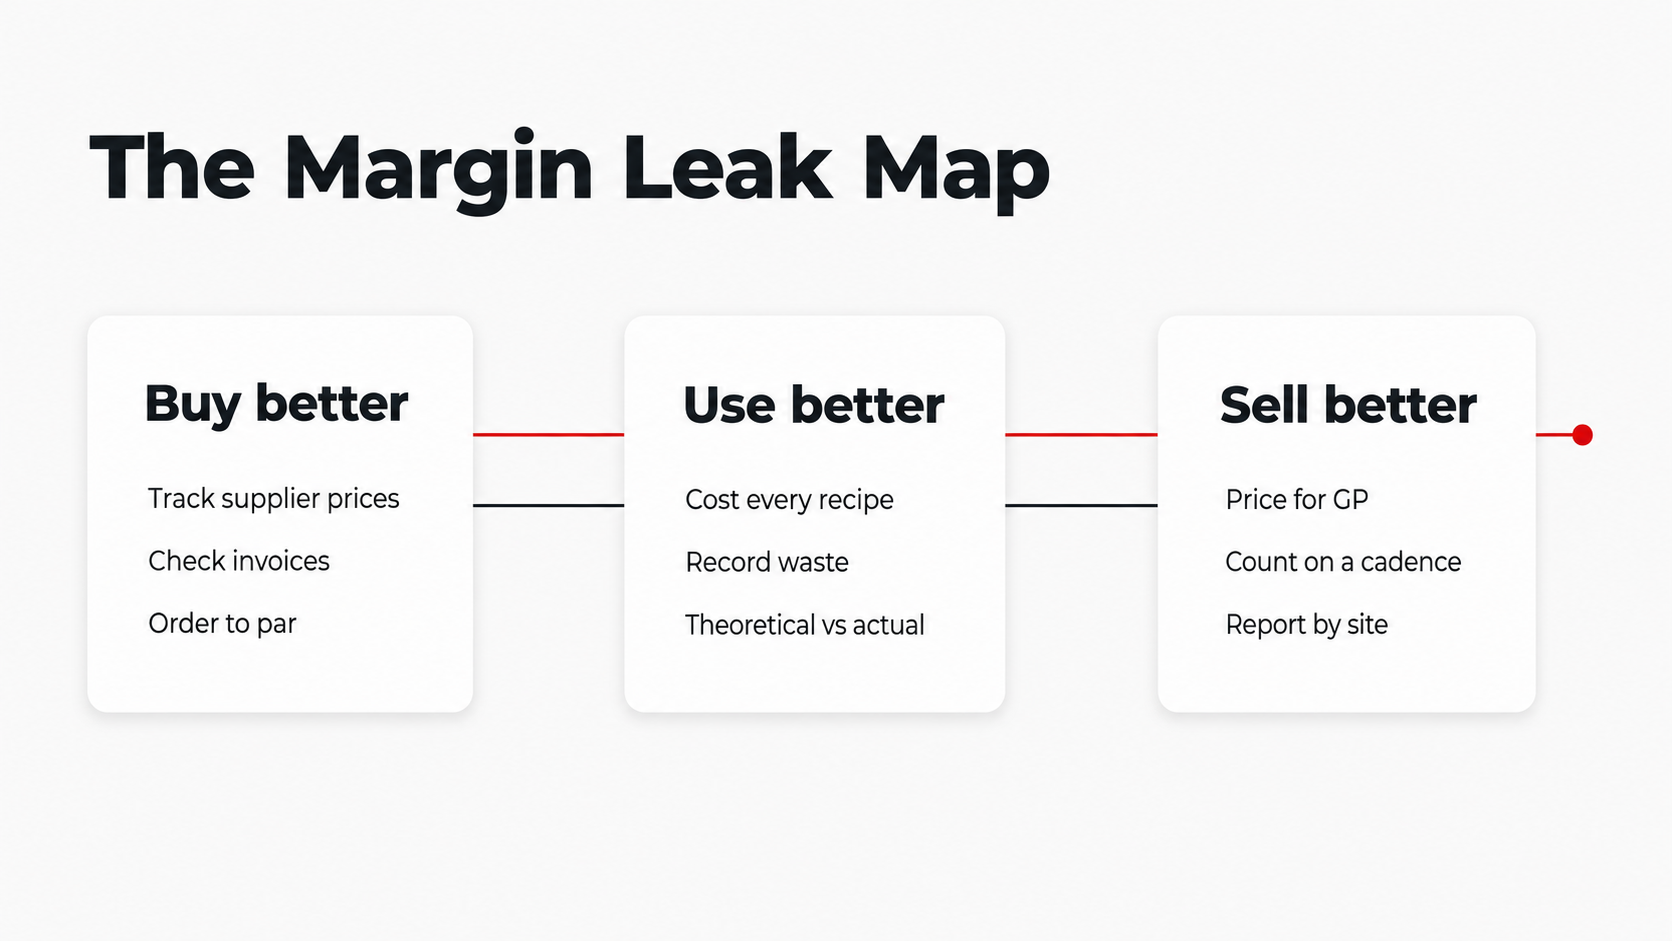
How do you sell better?
Lever 7: price the menu to protect gross profit. Review the menu with both numbers in view: each dish’s food cost percentage and its cash gross profit per plate. A dish with a flattering percentage but thin cash margin is not paying its way, and a high-percentage dish with strong cash GP might be. Promote the dishes that earn, re-engineer or re-price the ones that do not, and re-check whenever supplier prices move.
Lever 8: count stock on a fixed cadence. Counts are the feedback loop for every other lever. Weekly counts of high-value and high-movement items, with a disciplined full count on a regular cycle, catch problems while the cause is still in living memory. A count done quarterly tells you that money went missing; a count done weekly tells you where.
Lever 9: report by site and hold the line. In a multi-site group, food cost improves when every site sees the same numbers, cut the same way, on the same day. Site-versus-site variance reporting turns food cost from a head-office complaint into a kitchen-level habit, and it makes success visible when a team closes its gap.
How quickly should you expect results?
Honestly: it depends on where your leaks are, and any guide that promises a specific saving without seeing your numbers is guessing. What you can expect is a sequence. Within the first weekly count cycle you will know your real variance. Within the first month of invoice checking and price tracking you will know whether buying is part of the problem. Recipe costing takes longer to complete but starts paying back dish by dish as each one is costed. The levers compound, because every one you fix makes the variance number cleaner and the next leak easier to see.
How does inventory software help you reduce food cost?
Everything above can be done manually, and plenty of kitchens run it on spreadsheets until the day the spreadsheet quietly breaks. What software changes is the labour cost of the discipline: supplier prices update from scanned invoices, recipe costs recalculate automatically, counts happen on a phone or tablet, and theoretical versus actual variance appears without anyone building a formula. StockTake Online is cloud-based restaurant inventory software built for exactly this, with no dedicated hardware, used by hospitality operators from single sites to multi-site groups. If you are weighing up options, our guide to choosing food and beverage cost control software sets out the evaluation criteria.
Start with the numbers, not the software. Run your current menu through our free Food and Beverage Cost Calculators to see your theoretical food cost in minutes. If the gap between that number and your actual cost is worth chasing, Book a Demo and we will show you how the nine levers run day to day on the platform.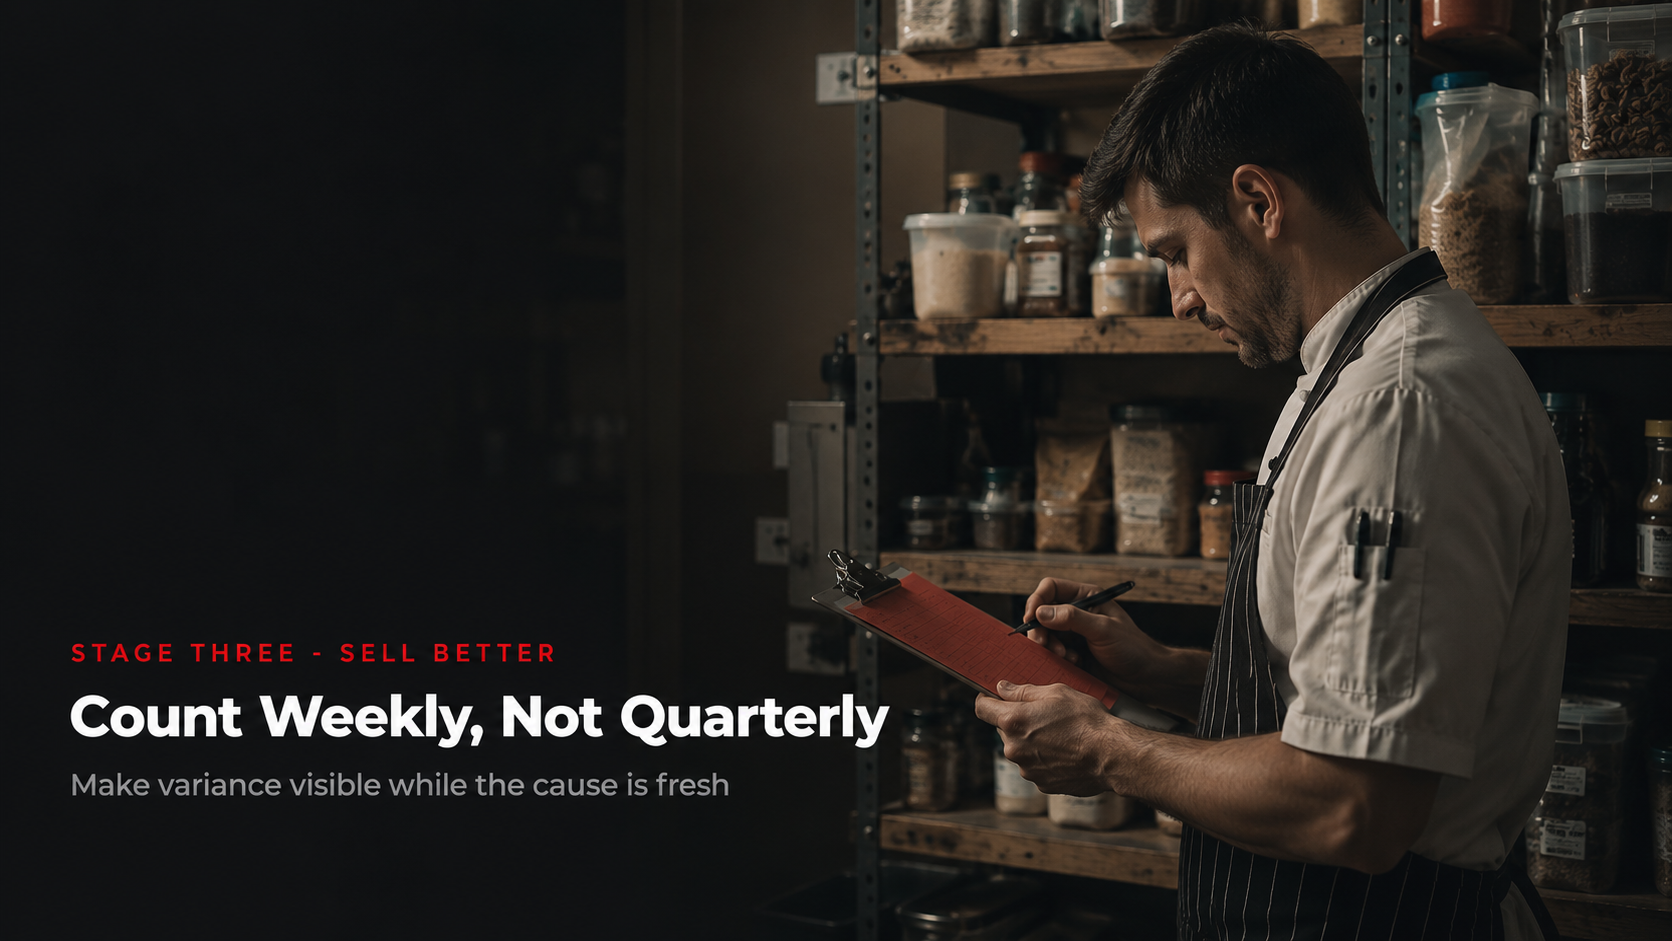
Key takeaways
- Reducing food cost means closing the gap between theoretical and actual cost, not cutting portions or quality.
- Work the Margin Leak Map in order: buy better, use better, sell better.
- Supplier price tracking and invoice checking stop leaks before food enters the building.
- Costed recipes, recorded waste and a fixed count cadence make variance visible and fixable.
- Measure results in gross profit protected, and use a calculator to establish your theoretical baseline first.
Frequently asked questions
How do restaurants reduce food cost? Restaurants reduce food cost by tracking supplier prices, checking invoices against deliveries, ordering to par, costing every recipe, controlling portions, recording waste, measuring theoretical versus actual usage, pricing the menu to protect gross profit and counting stock on a fixed cadence.
What is a good food cost percentage? There is no single correct figure. Many operators work to conventions in the region of 25 to 35 per cent depending on format, but the right target for your business comes from your own menu, gross profit goals and format. Establish your theoretical cost first, then manage the gap to actual.
Does reducing food cost mean cutting portions or quality? No. The recoverable money in most kitchens sits in the gap between theoretical and actual cost: price creep, invoice errors, waste, over-portioning and counting gaps. Closing that gap protects margin without touching the guest experience.
How often should you count stock to control food cost? Count high-value and fast-moving items weekly and run a disciplined full count on a regular cycle. Frequent counts catch problems while the cause is still identifiable; infrequent counts only confirm that margin has already been lost.
What causes food cost to rise? Common causes are supplier price increases passed through unnoticed, invoices that do not match deliveries, out-of-date recipe costs, unrecorded prep waste, over-portioning and stock counts too infrequent to reveal variance early.