




Wet stock is the easiest inventory in hospitality to control and the easiest to lose. Easy to control because everything is countable: bottles, kegs, cases, measures. Easy to lose because every serve is small, fast and poured by hand, hundreds of times a night. A bar that counts monthly is not managing its stock. It is auditing a loss that already happened.
This is the complete guide: what to count and how often, how pour cost works, where the margin actually leaks, and how variance turns a suspicion into a number. It is written for bar managers, licensees and operators running pubs, bars, hotels and venues in the UK.
What is bar inventory management?
Definition: Bar inventory management is the routine of counting wet stock, valuing it, and reconciling usage against till sales, so that pour cost, variance and gross profit per category are known weekly and every gap has an owner and a cause.
The wet side runs on the same logic as food: theoretical usage from sales, actual usage from counts, and a gap to explain. If that method is new, our theoretical vs actual guide explains the engine. Drink is simply where it works best, because serves are standardised and everything is countable.
How does pour cost actually work?
Pour cost is the drink’s ingredient cost divided by its selling price. Track it per category: draught, bottled, wine, spirits, cocktails. Categories behave differently, so a blended figure hides the leak. Cocktails need costing as recipes, ingredient by ingredient, exactly like a dish.
Worked example (illustrative only). A 70cl bottle of spirit costs 14 pounds. At a 25ml serve it should yield 28 serves: 50 pence each. Sold at 3.80 pounds a serve, pour cost is around 13%. Now the count: the till shows 24 serves sold per bottle emptied. Four serves per bottle are leaving without being rung: about 14% of the bottle, roughly 2 pounds of revenue lost per bottle at that price. Multiply by the speed rail. Figures and serve size are illustrative to show the method, not benchmarks or legal measures.
Where does bar margin leak? The Five Leak Points
Every wet-stock loss happens at one of five points. Name the point and the fix names itself.
|
Leak point |
What goes wrong |
The control |
|
Order |
Over-ordering, invoice and delivery mismatches, price creep on key lines |
Par levels, delivery checks, supplier price tracking |
|
Cellar |
Keg and line losses, temperature waste, unrecorded transfers between bars |
Line cleaning log, yield checks, recorded transfers |
|
Pour |
Free-pour drift, over-generous serves, spillage, comps unrecorded |
Measured pours, jigger discipline, comp policy on the till |
|
Till |
Drinks made and never rung, wrong buttons, voids abused |
EPOS sales mix reconciled against usage weekly |
|
Count |
Counts too rare, inconsistent method, guessed open bottles |
Fixed weekly cadence, same method, tenths on open bottles |
A line every experienced stocktaker knows, quoted here as an illustrative composite rather than a named source: "If the till says we sold it and the shelf says we did not, that is the conversation." Variance does not accuse anyone. It just says where to look.
How often should a bar count stock?
|
Cadence |
What it catches |
Honest cost |
|
Daily spot check (top 10 movers) |
Fast theft and free-pour drift, while the shift is identifiable |
Minutes per day |
|
Weekly full wet count |
Variance by category and line; the working control |
Under an hour with a phone-based count, longer on paper |
|
Monthly only |
The total loss, weeks after the cause has left the building |
Cheap to run, expensive to rely on |
The weekly full count is the hinge. Monthly counting confirms history. Weekly counting changes behaviour, because everyone knows the gap will surface while the week is still in memory.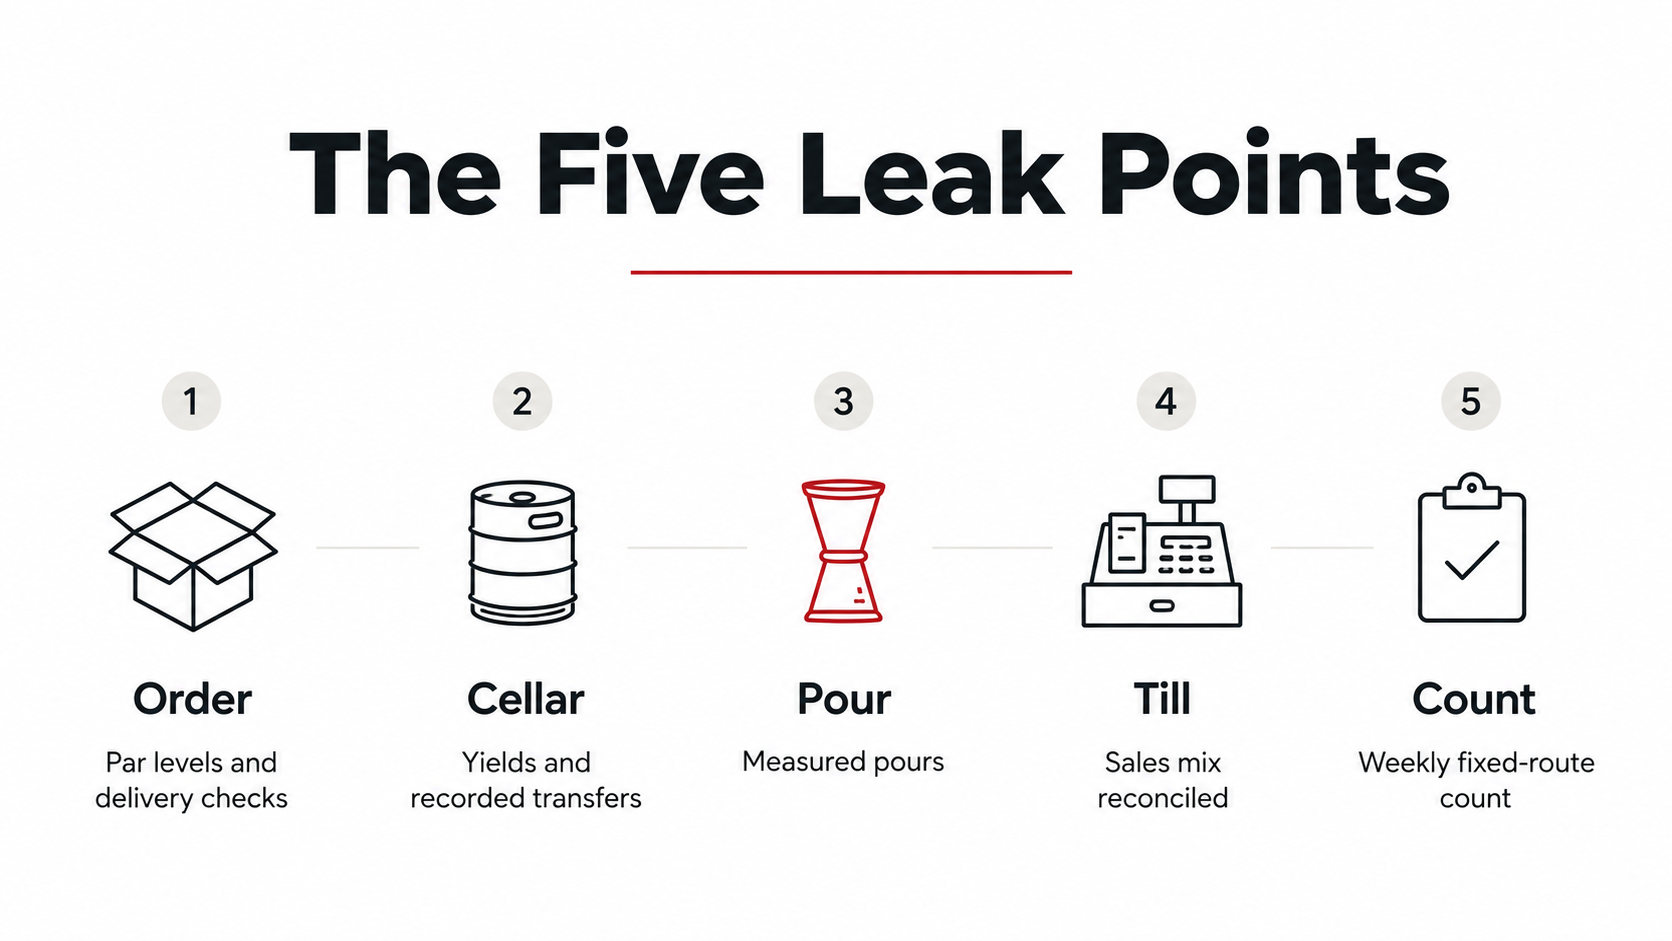
How do you run a weekly wet count that holds up?
- Fix the day and time, after close or before open, same every week.
- Count in a fixed route: cellar, store, back bar, speed rail, fridges. No doubling back.
- Count open bottles in tenths and kegs by weight or gauge, the same way every week.
- Record transfers between bars and to the kitchen as they happen, not from memory.
- Reconcile usage against the EPOS sales mix and price the gap in pounds, by category.
- Review the five leak points against the two worst categories and assign one fix each.
What should wet gross profit look like?
Set GP targets per category from your own costs and prices, and manage the mix as actively as the pour. The method for setting and defending those targets is covered in our guide to gross profit tracking and protection. Treat percentage conventions as folklore: your serve costs, measured, set the real number. Price movement is background, not excuse: according to the Office for National Statistics (June 2026), CPI rose 2.6% in the 12 months to June 2026, so a wet GP that slips faster than low single digits a year is leaking inside the building, not in the market.
How does software change the routine?
Nothing above needs software; all of it goes faster with it. Bar and brewery inventory management software runs the count on a phone in a fixed route, holds cocktail recipes and serve costs, records transfers, reconciles the EPOS mix automatically and prices the variance by line. Restaurant analytics rolls it up by category, bar and site, week after week, so the Five Leak Points review takes minutes.
Start with one number: run your top-selling spirit or draught line through the free beverage cost calculator and get its true pour cost. Then compare serves-per-bottle against your till. If the gap is real, Book a Demo and we will run a full wet count with you, live.
Key takeaways
- Count weekly; monthly counting is an autopsy, not a control.
- Track pour cost and GP per category, never blended; cocktails are recipes.
- Every loss sits at one of five points: Order, Cellar, Pour, Till, Count. Name the point, name the fix.
- Variance in pounds per category is the weekly conversation; it locates, it does not accuse.
- Record transfers and comps as they happen; unrecorded movement is indistinguishable from theft.

Frequently asked questions
How do you manage bar inventory? Count wet stock weekly in a fixed route, record transfers and comps as they happen, reconcile usage against EPOS sales by category, price the variance in pounds, and fix the worst leak point each week: Order, Cellar, Pour, Till or Count.
What is a good pour cost for a bar? There is no universal figure. Pour cost differs by category, price point and format, so set targets per category from your own measured serve costs and prices, then manage the gap between theoretical and actual usage.
How often should a bar do a stocktake? A full wet count weekly, plus a daily spot check on the ten fastest lines. Weekly counting surfaces problems while the cause is still identifiable; monthly counting only totals the loss.
How do you calculate bar variance? Take theoretical usage from EPOS sales and recipes, take actual usage from your counts adjusted for deliveries and transfers, and subtract. Price the difference by category. The result is the pounds that left without being sold.
How do you reduce shrinkage in a bar? Make the gap visible weekly. Measured pours, comps rung through the till, recorded transfers, tenths on open bottles and a fixed count routine remove the dark corners; variance by category then shows exactly where what remains is happening.